Archive for Enrollment data – Page 5

FIRST TIME IN SIX YEARS COLLEGE SEES INCREASED ENROLLMENT

Headcount up by 1.6% over last fall and total credit hours up by .7%

Dr. Ron Liss, who oversees instruction, and  student development for Yavapai College, reported to the Governing Board at its September session that for the first time in six years Yavapai Community College has shown increased fall enrollment. The total headcount District-wide was up this fall by 1.6%. The total number of credits being taken by students District-wide this fall was reported at .7%.

Liss credited the reopening of the Sedona Center and several other factors that resulted in the increase.  He gave a special “thank you” to the staff for their hard work in helping the College enrollment increase.

You may view his video report announcing increased enrollment below.
COLLEGE SAYS HEADCOUNT ENROLLMENT DISTRICT-WIDE IS UP 4.7% FOR FALL SEMESTER

Sedona Center enrollment up 1,235%

The College announced at the District Governing Board meeting on August 8, 2017 that headcount enrollment District-wide is up by 4.7%. In making the announcement, the College noted that it had been a long time since it had been able to announce enrollment was increasing. It also noted that enrollment at the Sedona Center was up by 1,235%. (Last year at this time enrollment at the Sedona Center was reported at 14.)

The Blog surmises the headcount is finally increasing for three reasons:  First, the administration is now using the telephone to contact students who they identified should have enrolled but did not for a variety of possible reasons. Second,  greater flexibility on dates to enroll. Third, the opening of the Sedona Center.

The announcement as reported to the District Governing Board by Dr. Liss follows below.


PERSONAL TELEPHONE CALLING SIGNIFICANTLY HELPS ENROLLMENT

Phone calls reduce number of students who do not continue from fall to spring semester from 14% to 7%

Yavapai Community College has adopted the old fashioned approach of calling persons who indicate that they are not continuing to the spring semester after completing the fall semester. According to the College’s Vice President of Instruction and Student Development Ron Liss, the calling has been very successful.  For example, the College lost 14% of students in 2016 between the fall and spring semesters. However, this year because of the work by the Student Development Department, that number was cut in half. Only 7% of students who completed the fall semester did not return for the spring semester. Repeated calling students who were identified as failing to register for the spring semester is credited with the reduction.

Dr. Liss also says that the College is starting earlier and extending the semester in an effort to be more user friendly. You may view Dr. Liss’s report on spring enrollment to the Governing Board by clicking on the video below.

DECLINE IN ENROLLMENT CONTINUES

Slide begun ten years ago continues

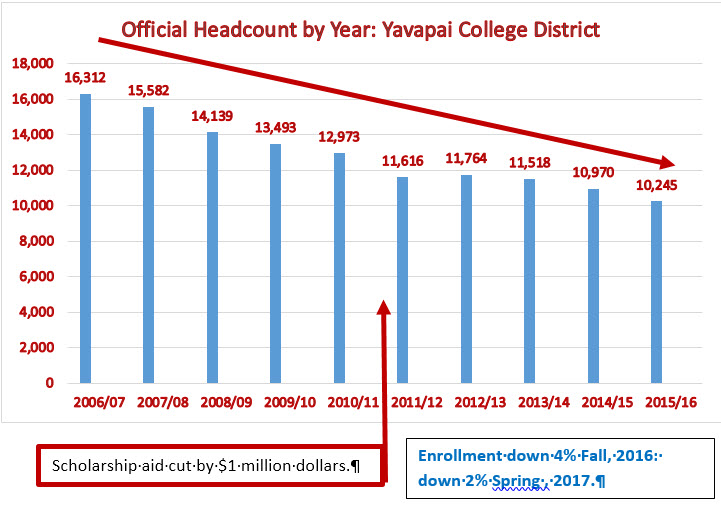
The College reported at the February 14, 2317 Governing Board meeting that enrollment was down district-wide by 4% in the fall, 2016 and by 2% in the spring, 2016.  The College seemed happy the spring reduction was not as great as the fall.

As the College has done for years now, it blamed the absence of a recession and was content to say its decline was similar to that of other community colleges.  The College and the Governing Board has done little to focus on the reasons for the decline.

The College stated that by simply calling students who had not re-registered for the spring semester, it caused several to do so.  (Not rocket science.)  This seemed to the Administration a novel idea.

The Verde Campus has shown a slight increase in enrollment (using headcount) over the past two years.

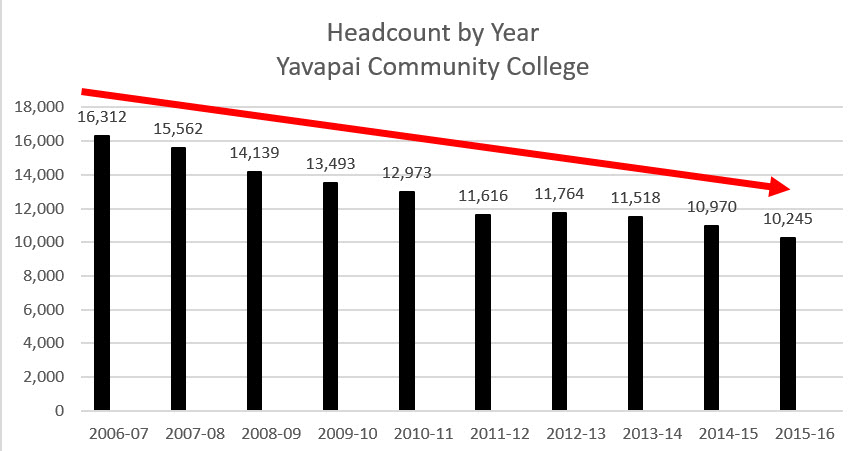
Here is a chart showing the decline of enrollment by more than 6,000 students over the past several years using actual headcount as announced by the College.


DISTRICT ENROLLMENT SLIDES AGAIN IN SPRING, 2017 — VERDE CAMPUS UP

College reports to District Governing Board a 2% decline in Spring, 2017 enrollment; Verde Campus up

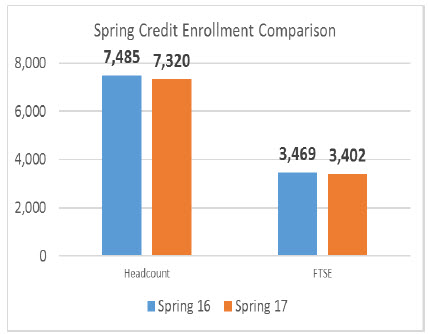
The College will report at the Tuesday, February 14 meeting of the District Governing Board that it has continued its ten-year slide in enrollment for students seeking college credit classes as measured by headcount.  According to data provided the public by the College prior to the meeting, total student (for-credit) enrollment in Spring 2017 is down 2% compared to spring, 2016.

The College will also report that the Verde Valley Campus experienced a “slight increase” in its on-campus headcount–a trend in the last two years. The Verde Valley Fall Community education programs  grew by 11%.

Online enrollment increased by 6% but the increase did not prevent the College from an overall decline as measured by headcount.  

The fall 2016 enrollment by the independently run Osher Life Long Learning non-profit corporation grew  by 22% when compared to fall 2015.  

The College did not report out the total comparative data regarding fall, 2016 enrollment in advance of the Tuesday, February 14 meeting.

Note that despite the continued decline in actual students, those who registered at the College took more classes for college credit when compared to students enrolling in spring, 2016. (Thus the Full-time Student Equivalent comparison.)  The following graph will be presented to the Governing Board at the Tuesday meeting by the College.


What’s Happening to Enrollment on the Prescott Campus?

Enrollment continues huge slide

One of the more puzzling questions about enrollment at Yavapai College has to do with the Prescott Campus. While enrollment at the Verde Campus has stopped its decline and has even shown a slight increase in the last year, the enrollment of students on the Prescott Campus continues in a precipitous slide.

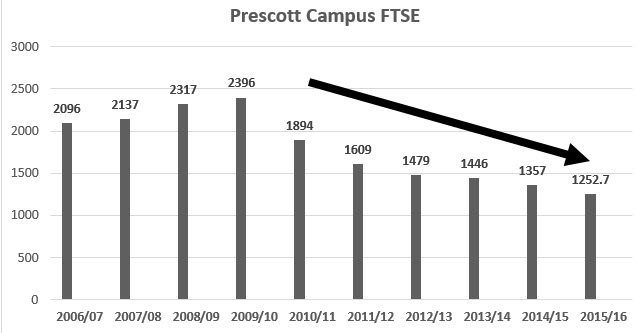
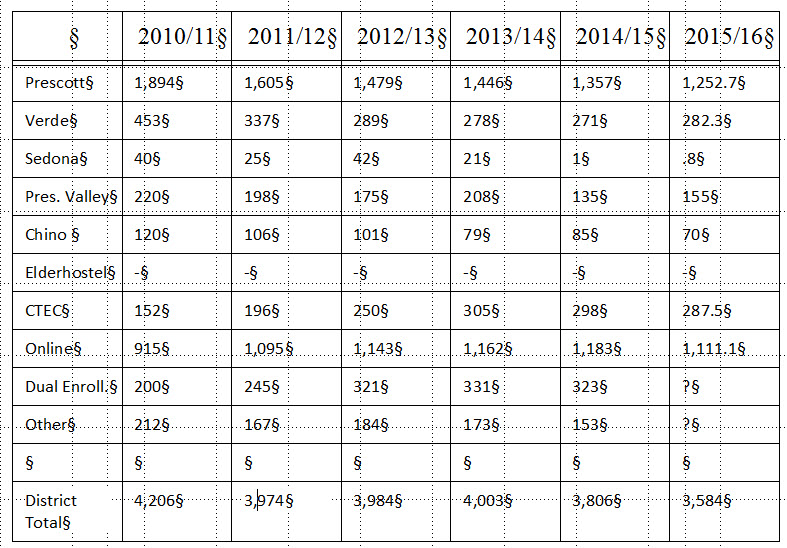
In the College fiscal year 2009/10, Prescott reported in its audited annual report that there were 2,396 Full Time Equivalent Students (FTSE).  One FTSE equals twelve credits. By comparison, the College reported in August, 2016 that enrollment during the 2015/16 fiscal year had plummeted to 1252.7. This is a drop of 1,143.3 FTSE. This is a huge  drop.

If one compares 20016/07 FTSE with 2015/16, the result is a fall of 843.3 FTSE.  The decline is all the more surprising because the current administration has invested millions of dollars in construction on that campus.  It is also the center for all sports programs, major sports facilities, the Performing Arts Center, and Dell Webb Family Enrichment Center.

The drop in one year from 2014/15 to 2015/16 was 104.7 FTSE.  In terms of enrollment, this is huge.

ENROLLMENT PRESCOTT CAMPUS TEN YEARS THRU 2016

College shows 6,000 students fewer by actual headcount than ten years ago

Audited unduplicated data shows continual slide in enrollment; slide to continue

Yavapai Community College now (August 20, 2016) has 6,000 fewer students taking credit courses of any kind for credit than it did ten years ago.  This is according to the data provided by the College for the academic years 2006 thru 2015/2016. All of the data has been audited with the exception of the figure for 2015/16.

The drop has occurred despite the addition of on-line courses and an increase in dual enrollment courses. Using those additions, and anything else the College could label a credit offering to boost the enrollment count, the decline remains over 6,000 fewer students than ten years ago.   

One of the explanations for the decline, according to the College, is related to the recession.  It claims that more students take courses during a recession.  Then, when the recession is over, the number declines.

The audited headcount data from the College does not support the College’s recession claim.  It shows a steady decline in the actual number of students taking credit courses beginning in 2006, before the recession, with the decline continuing through the recession up to the present time.

As noted above, the chart below is based entirely on audited College data, with the exception of the past year’s data, which has yet to be audited.  The College anticipates the slide will continue this year. Watch out for the College spin masters on this issue.

ENROLLMENT HEADCOUNT FOR TEN YEARS THRUGH 2016

The Verde Independent in an article dated August 18 (click here to read the article) quoted Yavapai College as explaining the decline in enrollment as follows: “Most of the decline in on-campus credit enrollments, says Hughes, “is the result of students migrating to on-line courses, not students exiting the college. Other factors impacting declining credit enrollment include an improving job outlook, and more community education and OLLI opportunities for personal interest students.”

As noted above, the total audited headcount included all students who were taking online, traditional in-class courses and any hybrid classes.  Moreover, OLLI is a program for persons 55 years old or more and OLLI is completely independent of the College Administration and control.  It is an independent 501(c)(3) organization created by a $2 million dollar grant to the College that pays for its independent operation.  It has its own governing committee that handles finances, curriculum, and other issues. Its faculty are not paid and it charges a fee for several of its programs to help support its independent operation.

Current fall enrollment decline remains problematic

College says rumor enrollment down by 15 to 17% incorrect

A check with Mr. Tom Hughes who heads the Yavapai Department of Institutional Research on August 3, 2015 indicated there is no truth to the rumor that the College applications for fall 2016 are down from 15 to 17%.  

Mr. Hughes stated that “as of this morning (August 2, 2016), FTSE was down 8.0%.  It is important to understand many factors influence enrollment and comparisons to the prior year, and it is common to see a lot of fluctuation throughout the enrollment period, especially this close to the beginning of the semester.”

 Frustraterd enrollment pencil


But still down by more than 400 FTSE since 2008/09

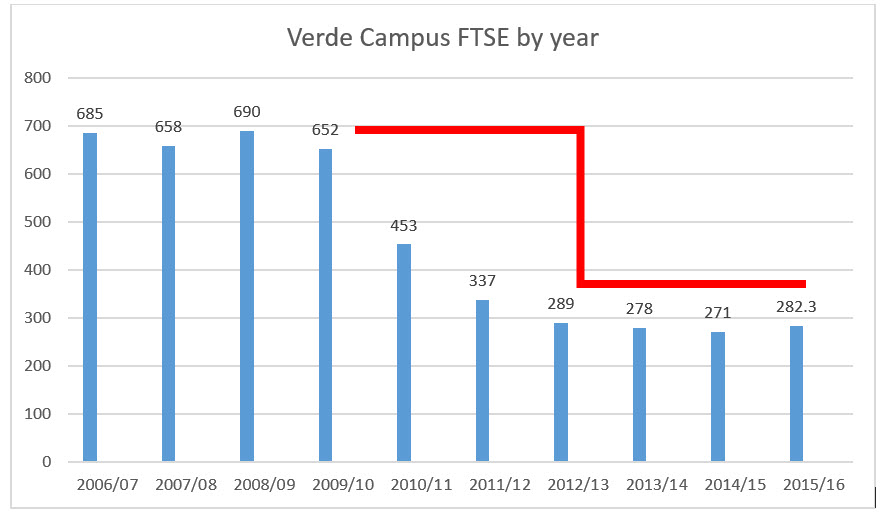
The most recent enrollment data for 2015-16 indicates that the Verde Campus is beginning to hold its own against the overall decline of students in the Yavapai Community College District.  Figures indicate that using Full-Time-Student-Equivalent as a measure, the Verde Campus increased by 11.3 FTSE.

A student who is full-time taking twelve credits is generally considered one FTSE.  Two students taking six credits each are generally considered one FTSE.  Six students taking two credits each are generally considered one FTSE.

The 2015-16 FTSE figure is down a little more than 400 FTSE from 2008/09.

ENROLLMENT VERDE CAMPUS TEN YEAR TREND THRU 2016 NUMBER 2

YAVAPAI COMMUNITY COLLEGE ENROLLMENT MEASURED BY FTSE CONTINUES SLIDING

DECLINE OF 622 FTSE IN SIX YEARS; DECLINE OF 222 IN LAST ACADEMIC YEAR

Yavapai Community College measures its enrollment using two figures:  One is called the “headcount” and the most recent headcount analysis appears in a previous Blog posting.  The  analysis in this posting involves the Full-Time-Student-Equivalent number.    FTSE is  an acronym that generally refers to a standardized measure of student enrollment at a department, division, or institution.  A full-time student taking 12 credits is generally considered one FTSE. 

While the actual number of students attending Yavapai Community College by headcount has fallen by a little over 6,000 in the past ten years, the FSTE has showed a slower decline in the total number of classes being taken.  The difference between headcount and FTSE  has been explained by the College as “fewer students taking more classes.”  By taking more classes, the FTSE percentage of decline has been slowed.

However, this past academic year of 2015-16, the FTSE decline was put at 220 in data furnished the Blog by Mr. Tom Hughes, Yavapai Department of Institutional Research on August 3, 2015.  The decline is at least partly to blame on the Veterans Administration  cracking down on Yavapai’s Veterans aviation program, which it found in violation of VA regulations. With the crackdown, Yavapai has apparently lost a significant number of students in that program.

Note: In order to obtain the data, a formal public document request was made by the Blog to the President’s office.  Employees are not allowed to share this information with the public unless it has been first funneled past the President.

ENROLLMENT FTSE FOR LAST SIX YEARS ENDING IN 2016